
LLM-Orchestrated Simulation, VR Co-Creation, and Bankable Youth Innovation Pipelines Towards Sustainability

Despite significant development and increased use of large language models (LLMs) for generating texts, images, videos and code, they have not yet reached the level of deep simulation of youth entrepreneurial projects or educational case studies. This article introduces a novel LLM-driven simulation platform that empowers youth, educators and policymakers to co-design and validate sustainable infrastructure projects through immersive 3D/VR (virtual reality) models and digital twins. Combining generative language guidance with physics-aware simulation modules, the platform translates high-level ideas into technical designs, cost estimates, environmental impact projections and financing pathways. Two Asia-Pacific case studies — a youth-led solar microfarm pilot and a coastal resilience living lab — demonstrate rapid ideation-to- prototype cycles and measurable reductions in time-to-investment. The article outlines technical architecture, pedagogy for educators, incubator integration, policy enablers and evaluation metrics. It concludes with a roadmap for scaling across the region, highlighting open-source governance and equitable access to ensure that youth-led innovations translate into resilient, self-owned solutions.
1. Introduction
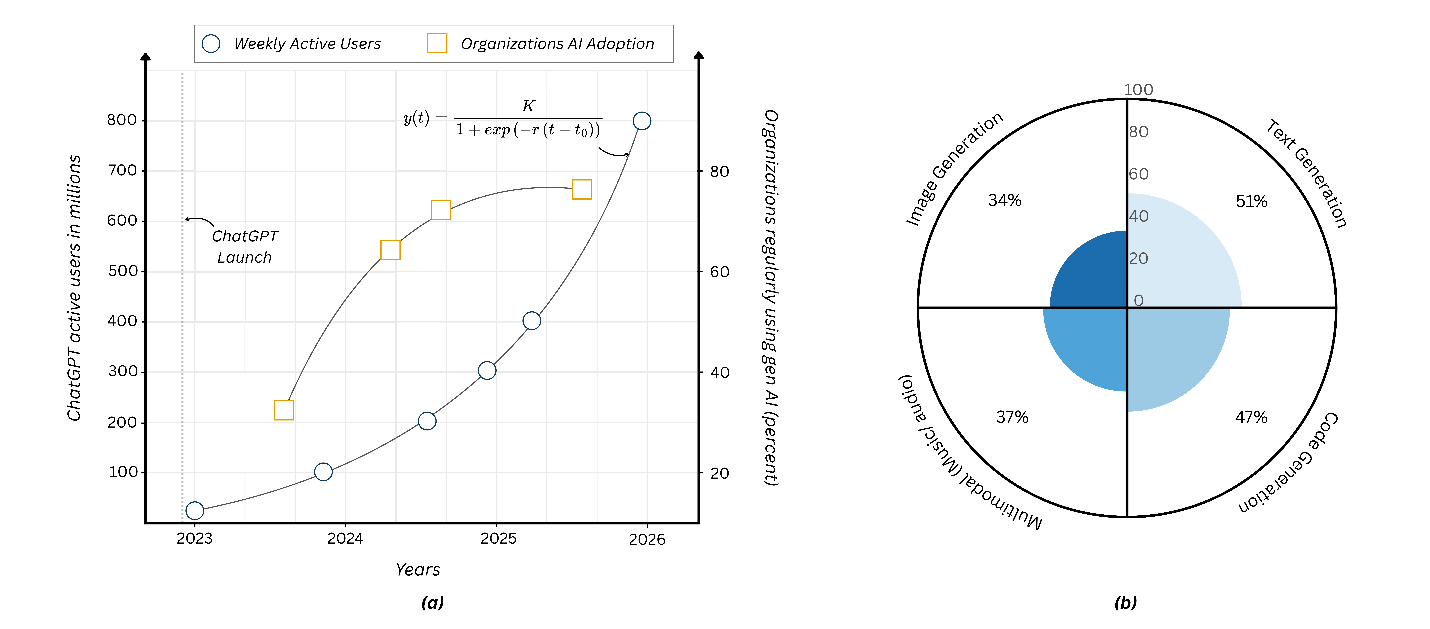
The past three years have seen explosive LLM adoption: conversational platforms reached hundreds of millions of weekly users by 2025–26, with some estimates reporting approximately 800 million weekly active users (Figure 1a) and billions of monthly visits (Singh, 2025). At the enterprise level, surveys show approximately 76 per cent of organizations now treat AI as a priority and approximately 69 per cent use generative AI in at least one function, signalling broad institutional uptake (Minevich, 2025).
For LLM usage, recent syntheses and market reports indicate that text generation and summarization remain dominant, while code generation, image generation and multimodal content (audio/video) are growing rapidly. Industry summaries place text at roughly 40–50 per cent of use cases, code at 15–25 per cent, image generation at 10–20 per cent, and video/multimodal under 10 per cent but rising (Muhammad, 2025). According to Bilski (2025), the greatest penetration of LLMs is in writing support at 51 per cent and coding at 47 per cent, followed by help with work or school assignments at 43 per cent, presentations at 38 per cent, music or audio at 37 per cent, and image generation at 34 per cent (Figure 1b). As LLMs move beyond chat into actionable design assistance, their value for simulation and engineering workflows becomes clear. This reveals a gap: current LLMs are widely used to describe, draft and generate, but are less often used (or incapable) to simulate, validate and stress-test.
The core problem is that conventional LLM outputs (text, code, images, sound, videos) do not by themselves produce validated, implementable infrastructure designs. Youth innovators, educators and local policymakers face three persistent barriers: (i) technical complexity — translating an idea into a site-specific design; (ii) slow validation — long iteration cycles with engineers and funders; and (iii) weak stakeholder engagement — difficulty visualizing proposals for communities and regulators. These gaps slow or block promising youth-led sustainable projects.
Consequently, this study proposes the integration of LLMs with lightweight physics engines and 3D/VR digital twins to address the gaps described above. The proposed LLM can translate a high-level brief into parameterized simulation scenarios, generate explainable design rationales and procurement documents, and craft culturally attuned stakeholder narratives for consultations. With the increasing need for simulation models (Abaddi, 2025), the simulation layer produces site-specific performance estimates (energy yield, hydrology, waste throughput), cost and carbon projections, and sensitivity analyses — all exportable as investor-ready artifacts. The solution is expected to shorten concept-to-prototype timelines from months to weeks or sometimes days. It should reduce upfront consultancy costs, and increase the quality of funding applications and policy briefs. For youth, the solution can help them develop their own projects and promote sustainability by providing realistic engineering simulation models supported by VR and digital twins, which can bolster their business plans, stimulate investment and reduce unemployment.
2. Core personas
This section defines five core personas (student, educator, entrepreneur, incubator manager, policymaker) and three concise user journeys that show how an LLM-orchestrated digital-twin platform converts youth ideas into funded, fielded sustainable projects — shortening design cycles, improving stakeholder buy-in and lowering costs. The approach is practical for Asia-Pacific contexts and adaptable to local curricula and municipal planning (for example, coastal towns and rural microgrids).
The core personas of the solution are:
- Student. Learns systems thinking through hands-on simulation sprints; uses guided prompts to test hypotheses and visualize outcomes in 3D.
- Educator. Designs modular curricula and assessment rubrics; runs classroom sprints and monitors learning gains via built-in analytics.
- Entrepreneur. Rapidly sizes projects (photovoltaic or PV, wind, water); obtains cost and payback estimates; and generates investor-grade documentation.
- Incubator manager. Runs cohort-based simulation sprints, matches teams to mentors and micro-finance, and tracks venture readiness metrics.
- Policymaker. Uses sandboxed scenarios to stress-test regulations, estimate community impacts, and preview policy outcomes with VR stakeholder walkthroughs.
Digital twins and simulation-based learning have recorded the advantages of active learning and the acquisition of practical skills, and are particularly useful when resources are limited or remote learning is involved. Recent reviews indicate that digital-twin-based e-learning enhances engagement and provides real-life lab experiences, which are otherwise lacking, to a vast number of students (Habarurema et al., 2025).
An example of a user journey is an entrepreneur sizing a PV microfarm. The entrepreneur inputs site coordinates, load and a detailed capacity profile. The LLM ingests open solar data, proposes panel layout and storage sizing, runs a physics simulation to estimate annual yield and variability, and produces a 3D/VR model that shows the flow of the entire system. It also provides a payback table, a procurement list and an investor pitch. Sensitivity analyses highlight risk drivers (irradiance, tariff). This reduces feasibility-study costs and accelerates investor conversations. The 3D/VR model can also be presented during the pitch deck. A second example is a policymaker who is stress-testing a coastal adaptation rule. The entrepreneur loads bathymetry and local survey data. The LLM generates scenario narratives (sea-level rise, storm surge), the simulation produces inundation maps and economic impact estimates, and a VR walkthrough helps community stakeholders visualize trade-offs. Policymakers iterate regulation drafts in a sandbox and quantify likely outcomes before formal adoption.
Both personas use the platform to reduce conceptual proposals to actionable, context-specific solutions — such as energy access programmes and circular-economy pilots — while magnifying local capacity and reducing the time spent securing funding.
Through the proposed system, human intent is transformed into actionable, sustainable solutions using layered intelligence and immersive visualization. At the entry point, diverse user personas — students, educators, entrepreneurs, incubator managers and policymakers — feed their goals and constraints into the LLM orchestration layer, which parses natural language, generates scenarios, and ensures regulatory alignment. These inputs flow into domain-specific simulation engines (solar PV, wind, hydrology, waste), producing validated technical outputs that are then embodied in a 3D/VR digital twin, enabling live motion models and stakeholder walkthroughs. Real-time data connectors enrich simulations with satellite imagery, Internet of Things (IoT) sensors and surveys, while downstream finance and policy modules convert technical insights into investor packages, cost–benefit analyses and compliance, as visualized in Figure 2.
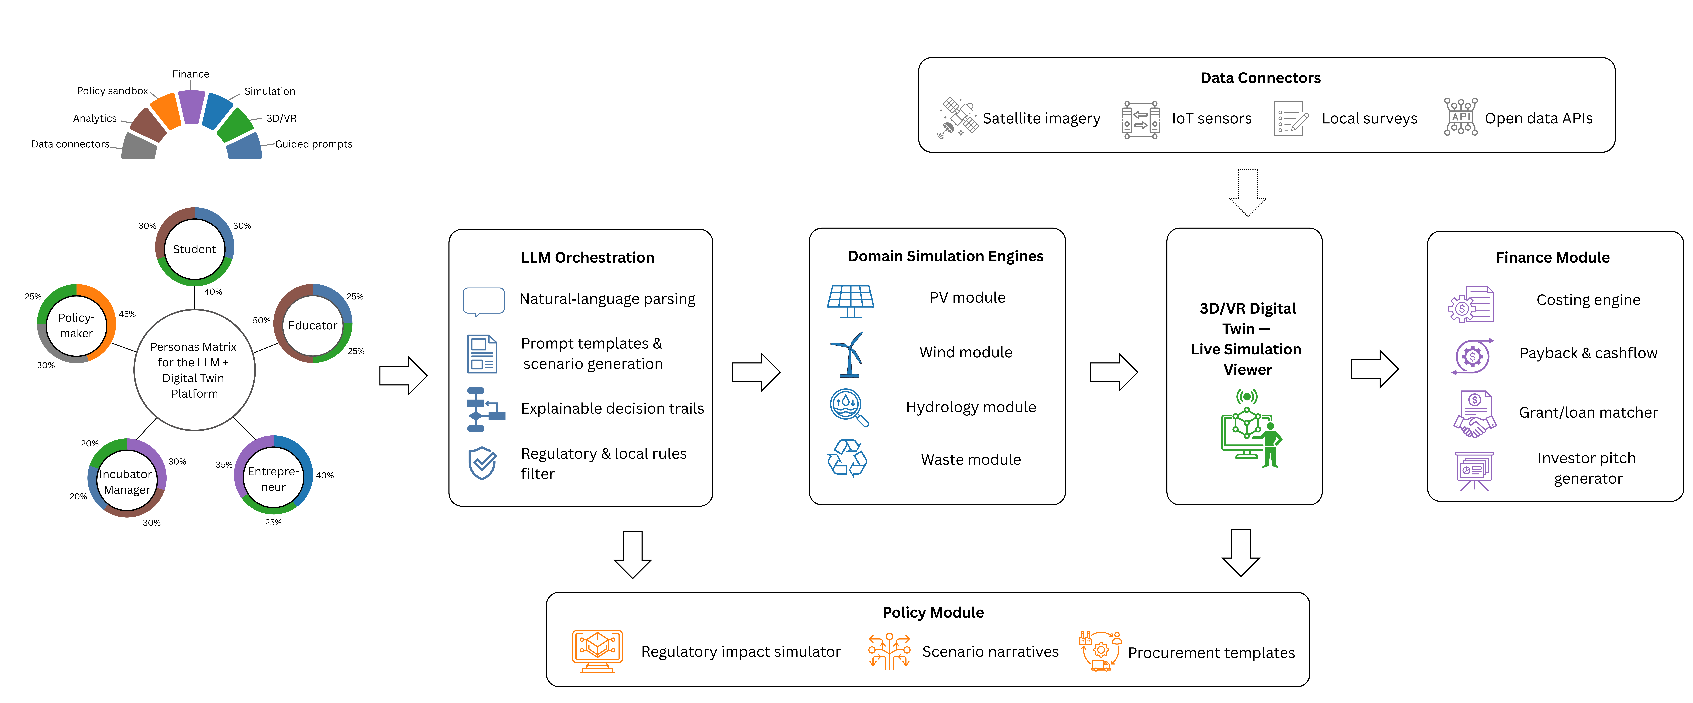 Figure 2. LLM + simulation system architecture showing the key personas. Source: developed by the author.
3. Technical architecture and core modules
The platform is built as a layered architecture that converts a natural-language project intent into an auditable simulation and a shareable digital twin. The architecture separates reasoning, physics, visualization and governance, so that each layer can be validated and updated independently. This is consistent with UNESCO guidance that emphasizes transparency, human oversight and clear accountability when generative AI is used (UNESCO, 2023).
User-initiated prompts are handled, at the entry point of the system, by a large language model, which converts them into structured design situations. The orchestration layer performs four critical functions: (i) natural-language parsing — converting unconstrained text into a collection of discrete parameters; (ii) scenario generation — producing a number of viable operational solutions; (iii) the creation of explainable decision trails — a documented rationale for each inference; and (iv) regulatory-aware validation — filtering results to remain acceptable under applicable statutory frameworks. Taken together, these measures help improve transparency and build trust in the system, reducing concerns related to opaque or black-box artificial intelligence (OECD, 2024). The mapping can be formulated as follows:
where U is user intent, R is the regulatory constraints, and S is the resulting simulation parameters. Once scenarios are generated, they are processed by simplified, validated, physics-aware models. For solar PV, energy yield is estimated as:
where G is irradiance, A is panel area, η is efficiency, and PR is the performance ratio. Wind energy follows the cubic law:
with air density ρ, swept area A, and wind speed v. Hydrology modules simulate runoff and turbine flow, while waste-to-energy engines model throughput and conversion efficiency. Each engine incorporates uncertainty quantification (for example, Monte Carlo sampling) and sensitivity analysis to highlight risk drivers, ensuring users understand variability rather than deterministic outputs.
The outputs of the simulations are realized in interactive digital twins that support fast scene generation and provide an opportunity to engage stakeholders in an immersive way. Parameters can be modulated through sliders, including panel tilt and turbine height; scenarios can be annotated, and walkthroughs captured by stakeholders. This participatory visualization helps overcome stakeholder resistance and speed up consensus. There is empirical evidence that virtual reality improves stakeholder engagement and spatial awareness by 62 per cent and 48 per cent, respectively (Shehadeh et al., 2025).
Data connectors and privacy modules combine satellite imagery, IoT sensor streams and open data to tune simulations. A federated-learning approach is used to protect privacy: on-site training of local models is performed using on-site data, and the models are then combined centrally. Local node updates Δwi are aggregated as:
Finally, technical outputs are converted into actionable financial and policy artifacts. Automated cost–benefit analyses, payback timelines and grant/loan matching are generated, while policy modules produce procurement-ready documentation and compliance briefs. For example, payback is calculated as:
where Cinit is initial cost and Sannual is annual savings. These modules ensure that youth projects are not only technically feasible but also financially viable and policy-aligned, bridging the gap between innovation and implementation.
The architecture (Figure 2) forms a closed loop: user intent → orchestrated scenarios → validated simulations → immersive visualization → enriched data → financial/policy outputs. It shortens design cycles, reduces costs and fosters participatory innovation.
4. Pedagogy, incubation and participatory governance workflows
The pedagogical core provides scaffolded, brief simulation sprints, where teams of students shift between problem definition and an investor-ready prototype within one to four weeks, sometimes in days. Teachers use the platform to set learning goals, seed prompts and assessment rubrics. At the same time, the large language model generates parameterized situations by translating briefs into relevant experiments. Learning gains are tracked with a normalized-gain metric:
Automated analytics, peer review and instructor annotation together form high-quality feedback loops that convert every sprint into a reproducible micro-credential. Empirical results show that digital twins and immersive technologies improve learning and comprehension of technical subjects and, consequently, facilitate active learning at scale.
Incubation workflows embed the platform into cohort-based acceleration. Incubator managers run staged cohorts: (1) rapid feasibility via LLM + lightweight simulation; (2) investor-grade refinement (costing, sensitivity analysis); and (3) pilot deployment with local partners. The platform automates deliverables — technical report, payback table, procurement checklist — reducing consultancy costs and time-to-funding. Key performance indicators for incubators include time-to-prototype, funds mobilized and venture readiness score (a composite of technical, financial and team metrics). Sensitivity outputs (for example, Monte Carlo percentiles) are surfaced to investors to quantify risk and de-risk early-stage capital.
Virtual-reality walkthroughs, operating in 3D, allow residents and officials to experience what it would be like to see a situation — a flood, a microgrid layout — before funds are spent; annotations and recorded consultations are brought in as auditable inputs to policy modules (Figure 3). This participation loop leads to more informed consent, local knowledge exposure and reduced negotiation cycles. Federated calibration ensures data sovereignty by having local sensor models modify global priors without transmitting raw personal data, allowing accurate local calibration while preserving privacy.
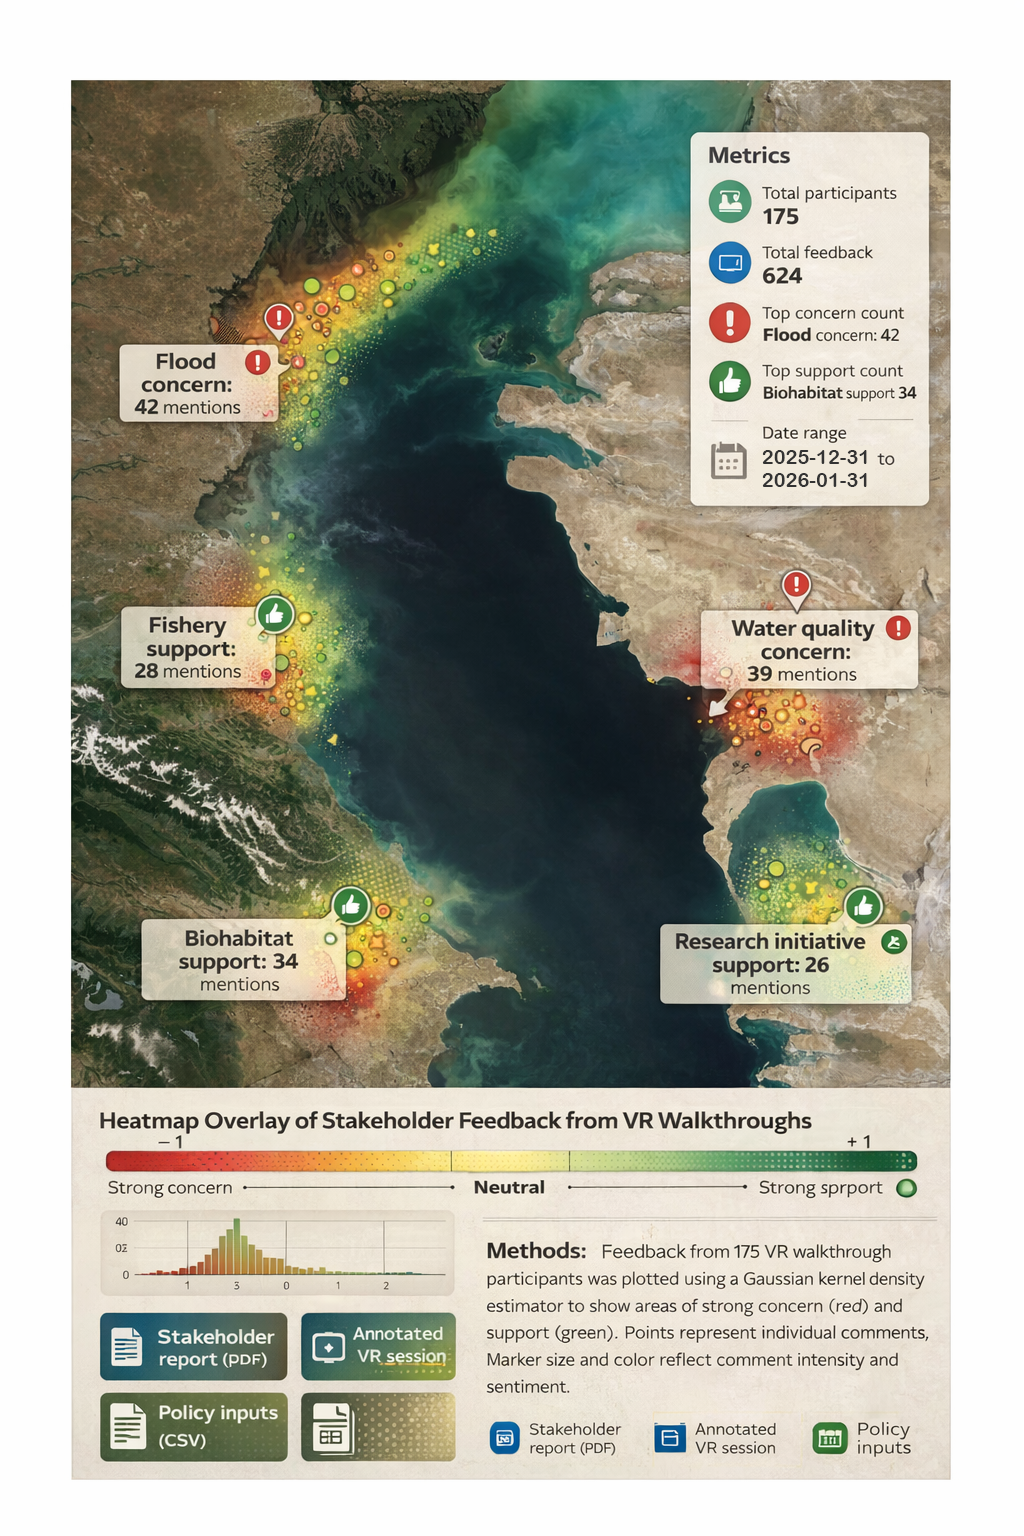 Figure 3. Sample of a community VR impact map. Source: developed by the author.
The intended effects are secured by the combination of three mechanisms: (1) modular curricula in the form of 2–4 week sprints based on specific competencies; (2) incubator pipelines that can be converted into funded pilot programmes; and (3) policy sandboxes allowing municipal staff to test regulatory propositions against the same simulations. The evaluation process combines quantitative values, including energy-yield error, capital generated and normalized learning gain g, and qualitative values, such as stakeholder satisfaction and governance preparedness.
5. Two Asia-Pacific case studies
Case study 1 — youth solar microfarm (Rajshahi Division, north-west Bangladesh)
A remote village faced unreliable grid access and seasonal load peaks that constrained livelihoods and evening study time. Local youth formed teams to design a community microfarm: a 20–30 kW PV array feeding household loads and a small agro-processing unit. The platform translated simple prompts (for example, “site: 24.5°N, seasonal load: 45 kWh/day”) into parameterized scenarios and ran rapid PV yield and storage sizing simulations (World Bank, 2015). Panel-layout optimization used irradiance maps and tilt/azimuth sweeps to maximize annual yield EPV using the relation in Equation (2).
A simplified energy balance was used to determine the necessary usable capacity by conducting storage sizing. Required usable capacity Cusable ≈ Lday / (DOD · ηbat), where Lday is the daily load, DOD is the allowable depth-of-discharge, and ηbat is the round-trip efficiency. The percentile band of yield and autonomy was determined through sensitivity sweeps (irradiance −10 per cent, load +20 per cent), which helped identify risk drivers relevant to financiers. The simulation outputs generated a procurement list, a 10-year cash-flow projection and a payback estimate (Equation 5). Virtual-reality visits using co-created layouts enabled community co-creation, and annotated stakeholder sessions allowed residents to modify array placement in order to retain shade trees and a shared walk. It was funded through a small community-level equity tranche, a local micro-loan, and an incubator seed grant; automated grant-matching services on the platform reduced application times. First-level performance metrics were a modelled capacity factor (projected at approximately 18–22 per cent), predicted annual production, and a projected four-to-seven-year payback window (hypothetical) based on tariff and load growth. This microfarm strategy is similar to approaches documented in rural Asian microgrid pilots (including rural electrification microgrids studied in Malaysia, the Philippines and Viet Nam), which focus on local ownership and phased financing (Brown et al., 2024).
Case study 2 — coastal resilience living lab (Semarang City, Central Java, Indonesia)
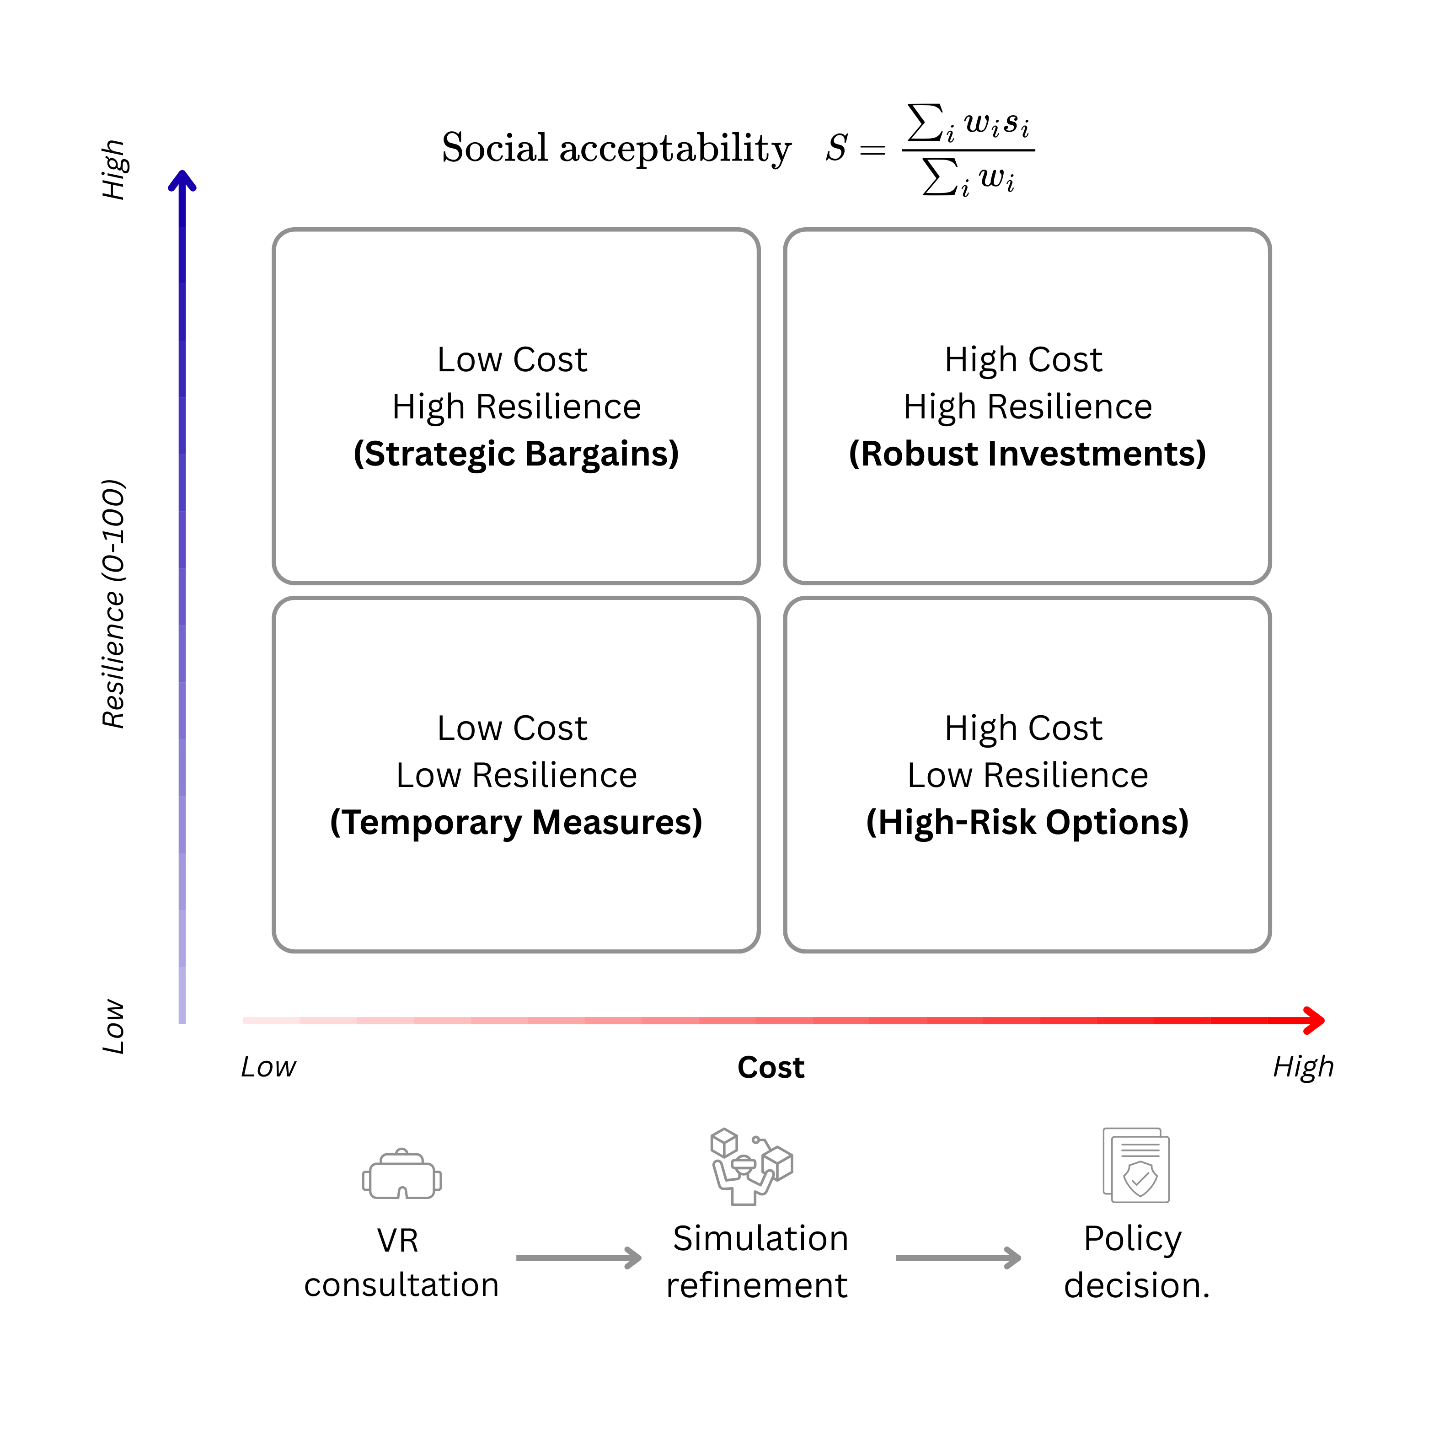
A coastal municipality facing increasing storm surge and erosion established a living lab to test adaptation options (Wetlands, 2019). The platform ingested remote-sensing data (satellite elevation and land cover), local household surveys and tide-gauge records; the LLM converted stakeholder inputs into scenario narratives (for example, “50-year storm + 0.5 m sea-level rise, protective berm versus managed retreat”) and generated parameter sets for hydrodynamic runs. Hydrology and inundation modules produced probabilistic inundation maps; outputs were rendered into a 3D/VR digital twin for community walkthroughs. During VR consultations, residents annotated areas of cultural importance and flagged access routes; these annotations were fed back into the simulation to test alternative alignments. LLM-crafted stakeholder briefs translated technical outputs into plain-language narratives and policy options, enabling municipal staff to compare cost–benefit and distributional impacts (Figure 4). The policy module produced procurement-ready scopes for a pilot berm construction and a monitoring plan. Early uptake included a municipal commitment to a pilot shoreline buffer and a conditional budget line pending a six-month monitoring window. Key technical practices were: (1) fusing remote-sensing with ground surveys for local calibration; (2) using Monte Carlo ensembles to quantify uncertainty in inundation extent; and (3) presenting results as probability-of-exceedance maps (for example, 10 per cent, 1 per cent events) to inform risk thresholds. The living lab accelerated stakeholder consensus by making trade-offs visible and auditable, improving the likelihood of policy adoption.
6. Evaluation, validation and impact metrics
The platform uses a risk-informed approach that separates conceptual validity, implementation verification and operational validity, and scales testing effort to decision consequence. This aligns with Sargent (2013) and with other credibility-assessment approaches for computational models.
For domain simulation engines, validation is anchored to reference tools and local measurements. PV yield estimates are compared with the United States National Renewable Energy Laboratory (NREL) PVWatts calculator at the same location and system definition, and recalibrated where local smart meter or sensor data are available, such as National Aeronautics and Space Administration (NASA) POWER open solar and meteorological feeds. Wind-resource priors are cross-checked against the Global Wind Atlas layers, with site-specific correction. Error and bias across PV, wind, hydrology and waste-to-energy are documented using normalized measures, including the normalized root-mean-square error:
and the normalized mean-bias error:
and the prediction-interval coverage probability:
along with a sensitivity-concentration score reporting how much output variance is explained by the top k inputs. These metrics support frugal data collection because they identify which parameters deserve local measurement.
For the LLM orchestration layer, validation focuses on traceability, safety and regulatory-aware validation. Every run generates a machine-readable decision trail recording prompt templates, retrieved sources, parameter defaults, rule checks and model versions. The proportion of claims with a cited source or a reported assumption is used to rate trail completeness. Rule-checking results are reported as pass rate and false-positive rate against a curated compliance test set. System-level assessment correlates with the trustworthiness features — validity, reliability, transparency and accountability — as defined in the National Institute of Standards and Technology (NIST) AI Risk Management Framework. In a federated-learning approach to local calibration, privacy assessment tracks whether raw data remains local and the privacy parameters in the case of differential privacy; convergence and drift metrics track the quality of learning (NIST, 2023).
Impact metrics connect technical quality to youth outcomes. In classrooms, learning gain is tracked using the normalized-gain metric (Equation 6) alongside rubric scores for assumption quality and scenario coverage. UNESCO reinforces the need for human agency, assessment integrity and responsible deployment in education, which these measures operationalize (UNESCO, 2023). In incubation and policy, the headline indicators are cycle time from concept to decision packet, cost of iteration, pilot conversion rate, and sustainability deltas such as emissions avoided and risk reduction, always reported with uncertainty bounds and equity flags.
7. Policy, financing and scaling roadmap
The primary factor determining whether a simulation LLM becomes trusted infrastructure or remains a pilot project is policy readiness. The roadmap therefore starts with governance that is readable by regulators, educators and communities. Specifically, the platform must align its controls with the trustworthiness functions in the NIST AI Risk Management Framework, and the complete life cycle of models and prompts must be explicitly documented, monitored and responded to. To become publicly adopted, the design should follow the recommended practices for traceability and explainability in the Organisation for Economic Co-operation and Development (OECD) public-sector advice on AI, and should release minimal transparency artifacts in the form of an algorithmic-transparency-register-style pattern per deployment (OECD, 2024). Interoperability matters across the Asia-Pacific. The platform should align its governance controls with regional voluntary frameworks such as the Association of Southeast Asian Nations (ASEAN) Guide on AI Governance and Ethics and its generative AI supplement, so that pilots can cross jurisdictions without reinventing safety and accountability each time (ASEAN, 2024). It should also reuse emerging assurance practices, such as the model safety evaluation approach outlined in Infocomm Media Development Authority (IMDA) and AI Verify Foundation materials, which focus on standardized testing and documentation of LLM-specific risks (AI Verify, 2024). Government has scaling leverage through procurement. In practice, one may begin by converting simulation outputs into procurement-ready packages and adopt risk controls aligned with government directions that specifically support generative AI procurement and use in the public sector.
Financing must be arranged to minimize first-year risk and reward proven performance. The platform supports this by generating standard technical, financial and governance artifacts that decrease transaction costs for funders and lower due-diligence time. Blended finance is a logical combination because it employs development finance to attract commercial capital towards sustainable development, but it requires transparency and local ownership to prevent low-quality deals. A leverage ratio can be reported as a simple indicator of mobilization:
and tracked across cohorts and regions. The World Bank notes blended finance as a mechanism to improve risk-adjusted returns and mobilize private capital for infrastructure and development gaps, which is directly relevant to youth-led sustainable ventures that struggle with early bankability (World Bank, 2025). On the supply side, multilateral development banks reported record climate finance volumes in 2024, alongside growth in private co-financing, which signals increased appetite for pipelines that are measurable and implementation-ready (Furness, 2025). The platform can connect ventures to instruments such as concessional loans, guarantees, results-based grants, and insurance or resilience clauses, while generating the documentation required for grants, green loans and procurement.
Scaling must proceed through a gradual-diffusion process that builds credibility before breadth. Stage one involves campus and incubator pilots that ascertain learning acquisition, model credibility and governance compliance under controlled conditions. Stage two comprises municipal living labs, where both the digital-twin layer and the public-participation workflow are refined using VR consultations and stress-tested rules. Stage three involves national and regional implementation, using template libraries across priority areas — distributed solar, coastal resilience and waste diversion — together with mutual evaluation criteria and transparency reporting. Federated calibration allows local performance enhancement at every level without centralizing sensitive data, and the assumption ledger and decision trail provide the audit spine required for policy use. The platform should report scale via a scorecard based on adoption and outcome, for example:
where Δt is cycle-time reduction from concept to decision packet, ΔC is avoided iteration cost, ΔE is verified emissions reduction or energy-access gain, and ΔR is resilience improvement — all reported with uncertainty bounds and equity flags. This approach turns scale into an evidence-based process rather than a marketing claim.
8. Risks, ethics and governance
Four risks are interwoven in model systems. When local conditions or social groups are under-represented in training data, the training data may produce model bias, resulting in systematically biased recommendations. Over-reliance on simulation also leads to fragile decisions when uncertainty or edge cases are brushed aside. Data-privacy risks include re-identification due to high-resolution sensor or survey data. Inequity of access increases existing inequity when tools and funds favour actors in urban or well-connected places. All risks have both technical and social dimensions and should be managed in equal measure, as shown in Table 1.
| Risk | Governance control | Trigger / metric |
|---|---|---|
| Model bias | Open validation datasets; bias audits | Bias score > threshold |
| Over-reliance | Mandatory uncertainty bands; decision gates | Exceedance probability > policy limit |
| Data privacy | Federated learning; differential privacy; retention limits | Re-identification risk test fail |
| Unequal access | Subsidies; local capacity grants | Participation gap > 20 per cent vs. baseline |
Mitigation and governance are ensured through the following measures:
- Transparency logs. Immutable, human-readable audit trails for prompts, model versions, parameter sets and decision rationales.
- Community review boards (CRBs). Local panels with diverse representation (youth, elders, women, technical advisers) that review model outputs, consent processes and pilot designs before procurement. CRBs provide social validation and can veto or require redesigns.
- Open validation datasets. Curated, anonymized benchmark sets for PV, hydrology and social surveys that enable independent replication and bias testing. Public datasets reduce single-vendor lock-in and enable third-party audits.
- Privacy-preserving pipelines. Federated learning, secure aggregation and differential privacy for local calibration; explicit data-minimization and retention policies; and cryptographic provenance for sensor feeds. Federated updates Δwi should be auditable while raw data remains local.
- Equity safeguards. Quota-based funding windows, subsidized access for marginalized communities, and capacity-building grants to ensure local teams can use and contest outputs.
Operational rules and triggers are as follows:
- Decision gates. Require testing, evaluation, verification and validation (TEVV) pass and CRB sign-off before tranche release.
- Performance triggers. If observed versus modelled deltas exceed thresholds (for example, capacity-factor error greater than 15 per cent), pause scaling and require recalibration and a public remediation plan.
- Transparency obligations. Publish model provenance, key priors and TEVV summaries with each funding milestone.
9. Conclusion and call to action
The integrated platform — combining LLM coordination, proven simulation engines, simulated pilots, immersive digital twins, privacy-preserving data connectors and finance/policy modules — offers a feasible pathway from early concepts to pilotable, locally approved ideas. Its power lies not simply in novelty, but in connecting explainable decision paths, uncertainty-sensitive outputs and participatory visualizations that shorten design cycles, reduce transaction costs and increase social approval. Three steps are clear to turn this potential into scale. First, implement 50 pilots across Asia and the Pacific in clearly defined subregions and Member States — for example, energy-access microfarm pilots in rural districts of Bangladesh, Nepal and Sri Lanka (South and South-West Asia), and coastal-resilience living labs in Indonesia, the Philippines and Viet Nam (South-East Asia), along with a small set of shoreline pilots in Pacific small island developing States, such as Fiji, Samoa and Vanuatu (the Pacific). Require TEVV summaries and open data to confirm findings, and publish results so stakeholders can scrutinize the evidence. Second, minimize risk and mobilize finance by establishing low-interest first-loss funds and procurement templates that accept digital-twin outputs, targeting private-capital leverage of three or greater. Third, enforce operational rules by requiring transparency logs, local community review boards and shared calibration of any funded pilot to prevent privacy harms and unfairness.
Stakeholders should act in various ways: funders to underwrite standardized TEVV and blended instruments; municipalities to open regulatory sandboxes and adopt procurement templates; and incubators to scale youth cohorts and convert top teams into blended-finance pipelines. The immediate objective is pragmatic: to prove that replicable models meet technical, financial and social thresholds within 24 months, so that municipalities can mainstream proven pilots into budgets and policy.